




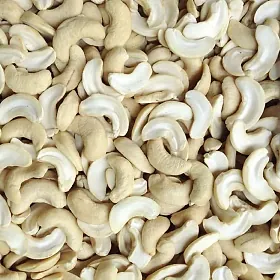


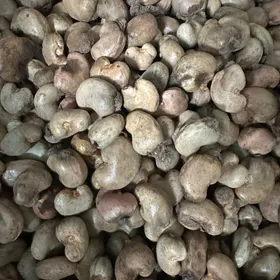





















July 2026 brief · 7 min read · By Tung Tran, Sourcing & Export Sales
Key takeaways
- A month that ships more tonnes is not automatically a busier market. Divide by working days before you read a month-on-month move as a demand signal.
- Export value can climb on volume alone. Rising value is not evidence of rising prices until you separate the two.
- There is no single "cashew price". There is a price for a named grade, on named delivery terms, resting on a stated volume — and nothing useful below that.
- Whole-kernel grades are defined by a checkable count per pound. Pieces grades are not, which is why a quoted "LP price" describes almost nothing.
- Where cargo is declared is not where it is consumed. Transshipment hubs are routing, not demand.
A note on figures
This brief carries no numbers, on purpose. Our monthly readings are built on customs declaration data we are not free to republish, and we will not put a figure in front of you that we cannot anchor to a public release. So this is a brief about direction and method: what moved in July 2026, and how to read a monthly cashew number without being caught out by it.
If you need levels rather than direction, ask us for a quote against your own grade and terms — that we can give you, and it will be a real number for your own basket rather than a national average that fits nobody.
Table of contents
- Was July a busier month than June?
- Did export value rise because prices rose?
- Which number is the real cashew price?
- Why do larger kernels cost more?
- Why is there no single LP price?
- Where cashews ship is not where they are eaten
- Do some regions pay more than others?
- Two things this brief cannot tell you
- What this means for your next order
Was July a busier month than June?
Not necessarily, and this is the single most misread comparison in monthly cashew reporting. A month with more working days ships more tonnes without anything happening in the market at all. Before you treat a month-on-month move as a demand signal, divide by the number of working days in each month.
The mechanism is dull and the mistake is expensive. Customs months are not equal units: they differ in length, in public holidays, and in how the Lunar New Year falls. A headline month-on-month percentage silently mixes two very different things — how much the market wanted, and how many days the ports were open.
Two habits fix it:
Convert to a daily run rate. Tonnes divided by working days is comparable across months in a way that raw monthly tonnage never is. If the run rate barely moves while the headline jumps, the headline is measuring the calendar.
Prefer the year-on-year comparison. Comparing a month against the same month last year puts two periods of broadly similar shape side by side. It is slower to react, but it is far harder to fool.
July ran ahead of June on raw tonnage, but the calendar explains most of that gap: this was a long working month. On a per-working-day basis the month was close to flat. The year-on-year comparison, which puts two months of similar shape side by side, is the sturdier read this time.
Did export value rise because prices rose?
Usually not, and you cannot tell without splitting the two. Export value is volume multiplied by price, so value can climb while prices sit still or even fall. "Value grew faster than volume, so prices must be climbing" is a shortcut that fails more often than it works.
The clean way to read it is to decompose the change into a volume part and a price part, grade by grade. When the volume part carries the increase, it was a busy month, not an expensive one — more containers moving, not better prices per container.
There is a second trap sitting behind the first one. Even the price part needs splitting again, because an average unit price moves for two unrelated reasons:
- Grades genuinely repricing — the market paying more or less for the same product. This is the part you care about.
- The mix shifting — Vietnam happening to ship proportionally more large kernels this month than last. This moves the average without anyone changing a price.
When the mix share of that move runs high, the headline "average export price" is telling you what the country shipped, not what buyers paid. When it runs low, the move is real. Any brief that quotes an average unit price without saying which of the two it was has not finished the analysis.
Export value rose, and it rose because more kernel moved, not because the market repriced. Decomposed across the core grades, volume carried the great majority of the increase.
The price move that did occur was genuine rather than a composition artefact — grades repriced on their own account, and the shift in what Vietnam happened to ship accounted for only a minor part of it.
Which number is the real cashew price?
There isn't one. There is a price for a named grade, on named delivery terms, resting on a stated volume. Strip any of those three away and the number stops meaning anything. Three rules make the difference between a price you can act on and a price that just sounds authoritative.
Medians, not averages. Cashew shipment prices carry long tails. A handful of very small consignments — a sample shipment, a rush air freight, a distressed lot — will drag an average somewhere the market never went. The median is what a typical shipment actually cleared at, and it does not flinch at outliers.
One Incoterm at a time. FOB, CIF, DAP and CFR are different products with different costs baked in. Comparing an FOB number against a CIF number is not a price comparison; it is a freight comparison wearing a price costume. FOB is common but it is never the whole of a month, so any national price figure rests on the subset that shipped on those terms — and that subset is the real denominator behind the number.
Always ask what the number stands on. A grade median resting on a large volume across many shipments is solid. The same-looking median resting on a handful of lots is indicative at best, and a few unusual consignments can move it. The high-volume workhorse grades give you sturdy readings; the premium grades, which ship in far smaller quantities, give you thinner ones. Both get quoted with the same confident tone.
The practical test: when someone gives you a cashew price, ask which grade, which terms, and how much volume sits behind it. If any of the three answers is missing, you have been given a number, not a price.
Why do larger kernels cost more?
Because whole white cashew grades are defined by how many kernels fit in a pound, and fewer, bigger kernels are harder to produce. The size ladder is the most reliable structure in cashew pricing — and the step most often skipped in procurement maths, because "the cashew price" almost always means W320.
| Grade | Kernels per pound | Role |
|---|---|---|
| WW180 | 160–180 | Large-kernel premium tier — gifting, festive boxes, premium retail |
| WW240 | 220–240 | The internationally recognised premium grade |
| WW320 | 300–320 | Highest-volume grade worldwide, and the usual reference price |
Each rung up that ladder needs larger raw kernels and more selective processing, and the supply of both is limited. So the premium is structural, not a seasonal quirk — it is there every month, and the step from W320 up to W180 is consistently much larger than the step from W320 to W240.
What this does to a buyer is specific. If your product needs whole, visibly large kernels — gift packs, premium retail bags, roasted-and-salted lines where every nut is seen — you are buying at the top of the ladder, while every market report you read is quoting the bottom of it. Benchmarking your basket against a W320 reference will understate your cost systematically, in every month, by a margin that is not small.
Before you accept or challenge a quote, establish which grade the reference number describes. Half the "your price is too high" conversations in this trade are two people comparing different grades in good faith.
The size ladder held its usual shape. Both W240 and W180 cleared above W320, and the step up to W180 was, as it normally is, far larger than the step up to W240.
Why is there no single LP price?
Because Large Pieces is not a defined size the way W320 is. Whole grades are set by count per pound — a physical property anyone can check with a scale. Pieces grades are not, so what falls into "LP" shifts with colour, scorch level, moisture, the governing standard, and how the processing line ran that week.
The consequence is that LP is consistently the most dispersed of the core grades. The gap between the high end and the low end of LP shipments is wide enough that no single figure sits meaningfully in the middle of it. Two lots both honestly labelled LP can be genuinely different products, sold to genuinely different buyers, at genuinely different prices — with nobody misrepresenting anything.
What follows for a buyer:
- Asking "what is LP going for?" will get you an answer that is technically true and commercially useless.
- Specify what you actually need first — colour band, defect tolerance, moisture, and which standard governs the reading (AFI, the Middle East convention, China-2) — then ask for a price. The spec is what makes the number mean something.
- If you are buying pieces for an application where appearance does not matter — nut butter, bakery inclusions, confectionery, ice cream — the low end of that dispersion is a genuine opportunity, not a trap. The spread exists because the specifications really do differ, not because someone is overcharging.
LP remained the widest-dispersed of the core grades — by some distance the grade where a single quoted price tells you least.
Where cashews ship is not where they are eaten
A meaningful share of Vietnam's kernel exports is declared to transshipment hubs — Singapore, the UAE, the Netherlands, Hong Kong — where the goods are still moving rather than being consumed. Reading hub tonnage as demand double-counts a leg of the journey, and it is why a hub's share can jump in a month without a single extra bag being eaten there.
This is the most common misreading of destination tables, and it flows in one direction: it makes hub markets look like appetite and makes the real end markets look smaller than they are. A shift in hub share is usually telling you something about routing, freight rates, or a distributor's inventory timing — not about consumption.
The correction is simple once you know to apply it:
- Read hubs as routing. Their share moves with logistics decisions.
- Read end markets — the United States, Germany, Turkey, Israel, and the large domestic consumers — as demand. Their share moves with appetite.
- Treat any destination ranking that mixes the two without flagging it as an unfinished piece of work.
The familiar pattern held: a small group of destinations took the bulk of the month, and a meaningful slice of that was declared to ports that are transshipment hubs rather than places anyone eats cashews.
Do some regions pay more than others?
Some regions consistently show a higher median on comparable terms, but that is not the same as paying more for the same product. Grade mix differs sharply by route, and a region that takes proportionally more large kernels will show a higher median without anyone paying above market for anything.
This is the confound that ruins most regional price commentary. A route dominated by the workhorse grade and a route weighted toward premium sizes will produce different medians by construction. Announcing that one region "pays a premium" without holding the grade mix constant is comparing two different shopping baskets and calling the difference a market finding.
To read regional prices honestly you need three things, and in a normal month you can only get two:
- The same delivery terms across every region compared. Achievable.
- A large enough sample in each region — a median resting on a handful of shipments is noise wearing a decimal point. Usually achievable if you set a minimum and drop the regions below it.
- Even grade identification across regions, so you can hold the mix constant. This is the one that usually fails, and the next section explains why.
Without the third, the honest statement is "this region's median is higher, and we cannot yet tell you how much of that is mix" — which is less satisfying than a premium figure, and considerably more useful than a wrong one.
The Middle East again showed the highest regional median on comparable terms. This month cannot settle how much of that is a genuine premium and how much is simply a different grade mix on that route — the grade coverage was not even enough to test it.
Two things this brief cannot tell you
Two structural limits sit inside any month of Vietnamese cashew export data: overland trade to China is priced on terms that do not compare to a seaport quote, and grade identification coverage varies widely between destinations. Both quietly distort figures that look clean.
1. Border trade is priced on different terms. A real share of kernel moves overland to China, declared in Vietnamese dong at a price that already contains the cost of getting the goods to the frontier. Those declarations are not comparable to a seaport FOB figure — the cost structure is different before you start. Including them silently pulls national medians around, and the pull is small enough in any one month to go unnoticed and large enough to matter once you stack several months into a trend.
2. Grade coverage is uneven, so grade-by-region tables are off limits. A grade can only be read where the customs description carries enough detail. In some destinations almost all volume resolves to a grade; in others, only a fraction does. A low figure means missing description, not missing cargo. Any table crossing grade against region is therefore comparing a well-lit room with a dark one and presenting the difference as a market finding — so we do not publish one.
We would rather show you the gate than a confident number that will not survive contact with your own data. If a supplier hands you a grade-by-region price matrix for a month, ask what share of volume in each cell could actually be identified. The question is usually enough.
Both structural limits applied in full this month: a real share of volume went overland to China on terms that are not comparable to a seaport quote, and grade identification was far better in some destinations than others.
What this means for your next order
Five rules that survive every month, whatever the numbers happen to do: name the grade, fix the Incoterm before comparing anything, ask what volume sits behind every price, price your own basket rather than the national average, and separate routing from demand.
- Name the grade. A quote without a grade is not a quote. The gap between the workhorse grade and the large-kernel grades is structural and substantial.
- Fix the Incoterm first. Any two prices you compare must sit on the same delivery terms, or you are measuring freight and calling it price.
- Ask what the number stands on. The same median means different things resting on a large sample and on a handful of lots.
- Price your actual basket. If your product skews to large kernels, benchmarking on the reference grade will understate your landed cost systematically, every single month.
- Separate routing from demand. Hub destinations tell you how goods travel, not who eats them.
This is a method brief. It publishes no market figures, by design: our monthly readings draw on customs declaration data we are not free to republish, and we do not put figures in front of buyers that we cannot anchor to a public release. No shipment-level, exporter-level or buyer-level information appears here, and no company is named.
Next steps:
- Send us your grade, volume, destination port and target shipment window — we come back with a quote on stated terms, with the specification written out so you can compare it against anyone: Contact us
- Coming next: Cashew grade codes explained — shape, colour and count and How to write a cashew RFQ that gets a real quote in 24 hours